📢 Please take a minute to read this personal message from the creator of River Levels UK


This is an archived message. The status has changed more recently.
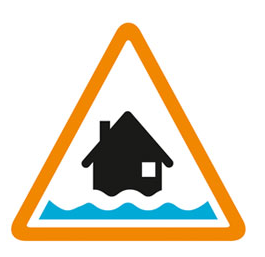
Flooding possible. Be prepared.
High tides on Tuesday may lead to flooding.
Flooding is possible from 07:15AM to 11:15AM and then 7:45PM to 11:45pm on the 17 February 2026.
Further flood alerts may also be in place for Wednesday and Thursday high tides. Areas most at risk include Christchurch Harbour and tidal stretches of the Lower Stour and Avon. The detailed tidal forecast for those who use it is - the first forecast high water of 1.20 mAODN is at 09:14AM, which is 0.42m above tide tables, with north westerly force 4 winds. The second forecast high water is at 09:45PM with a level of 1.25mAODN with easterly force 5 winds. (mAODN is height above average sea level.)
We are closely monitoring the situation .
Avoid coastal roads, footpaths and carparks, which may be flooded . Don't put yourself or others at risk
This message will be updated by 5:00PM on 17 February 2026 or as the situation changes.
Information supplied by the Environment Agency
This information last updated 3:51pm, Monday 16th February.
This page is a dedicated URL for a specific message issued at a particular time. You should not bookmark this page, as the current situation may have changed since this message was issued.
Warning no longer in force
Mon 31 Aug 2026, 9:59am
Flood alert
Sun 30 Aug 2026, 2:58pm
Warning no longer in force
Fri 17 Jul 2026, 8:51am
Flood alert
Thu 16 Jul 2026, 6:41pm
Warning no longer in force
Sat 21 Feb 2026, 2:54pm
Flood alert
Fri 20 Feb 2026, 4:10pm
Flood alert
Thu 19 Feb 2026, 3:14pm
Flood alert
Wed 18 Feb 2026, 5:09pm
Flood alert
Tue 17 Feb 2026, 3:44pm
Flood alert
Mon 16 Feb 2026, 3:51pm
Christchurch Harbour and tidal stretches of the Lower Stour and Avon
Region: Wessex
Country: England
Counties covered: Bournemouth, Christchurch and Poole
Watercourses covered: English Channel
The area bounded in blue on the map shows the area covered by flood alerts and warnings for Christchurch Harbour.
Note: the area shown on the map is the area covered by flood alerts and warnings. It is not a live map of current flooding. The area covered broadly equates to the area where the risk of flooding in any year is greater than 1% (the "hundred year" flood risk).

No current or recent warnings.
No current or recent warnings.
No current or recent warnings.
No current or recent warnings.
No current or recent warnings.